Filtering, Date Ranges & Exporting
Master the filter bar on every report - property, unit, and date range - then print, save as PDF, or export to a spreadsheet.
Find the filter bar
Every report has a single filter bar that sits just under the title, above the report content. From left to right it contains: - A property (group) selector - A unit selector - Quick date presets - Today, Yesterday, This Week, This Month, Last Month - A From date and a To date - An Apply button that appears only when you change a date manually This one bar controls everything the report shows - the summary tiles, the chart, and the table all update together when you change it.
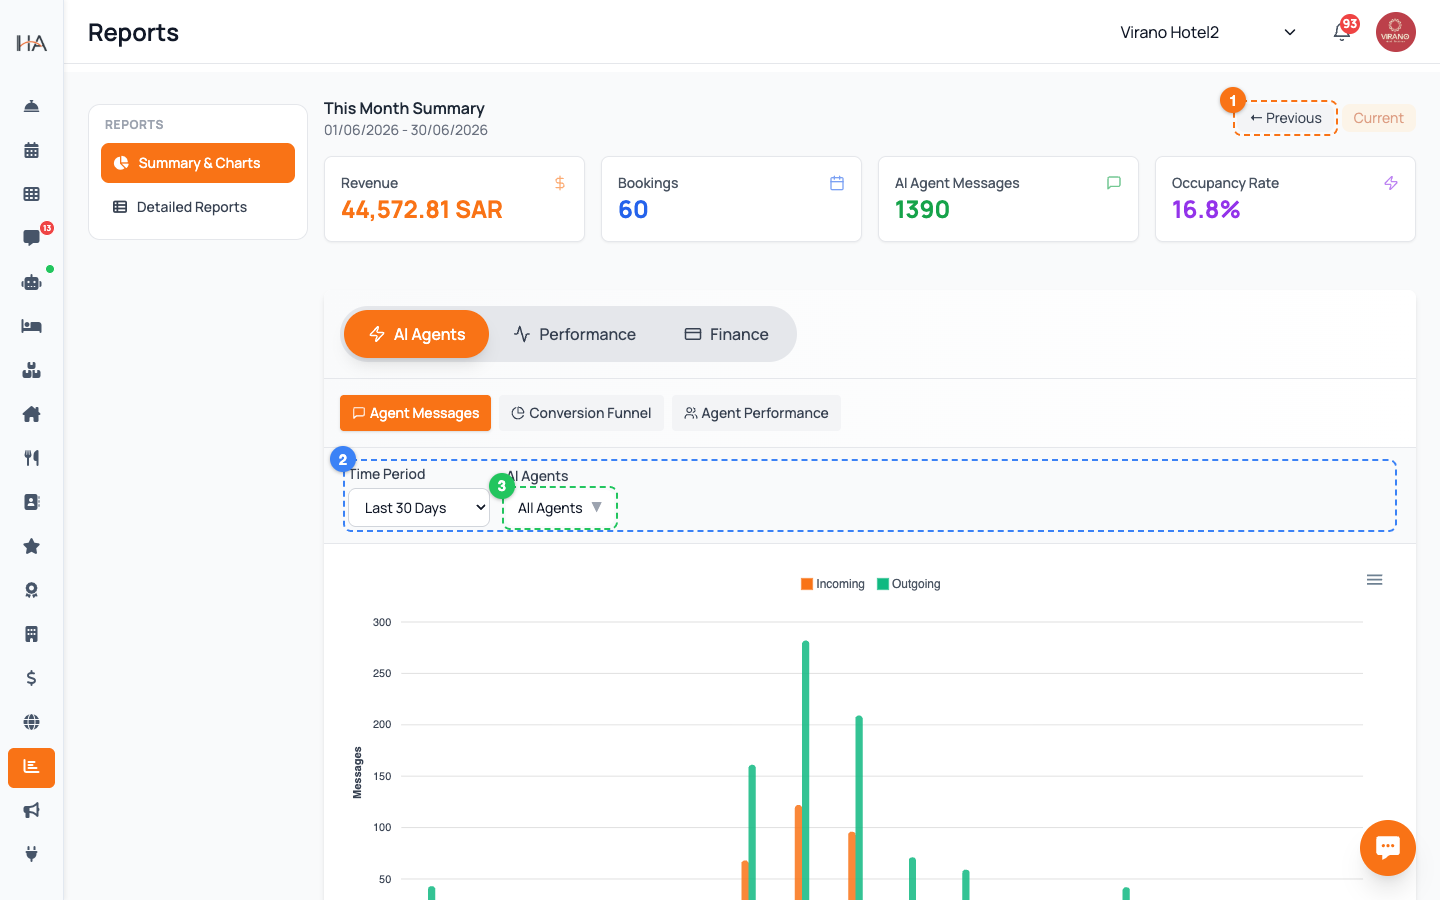
Filter by property and unit
Start by narrowing the location: 1. If you manage more than one property, open the property (group) dropdown and choose one, or leave it on All Groups to combine them. If you have only one property, its name simply shows as a fixed label. 2. Open the unit dropdown to focus on a single room, or leave it on All Units for the whole property. Changing the property automatically resets the unit list to All Units, since the rooms differ between properties. Pick the property first, then the unit.
Use the quick date presets
The fastest way to set a period is the preset buttons: - Today - just today's figures - Yesterday - the full previous day - This Week - from the start of the week up to today - This Month - from the 1st of the month up to today - Last Month - the whole of the previous calendar month Click a preset and the report reloads instantly - there is no separate Apply step for presets. The active preset is highlighted so you always know which range you are viewing. Last Month is the go-to choice for end-of-month reviews.
Set a custom date range
For any other period, set the dates yourself: 1. Click the From date field and pick a start date from the calendar 2. Click the To date field and pick an end date 3. An Apply button appears - click it to load that exact range Two helpful rules: - You cannot pick a future date for the start - reports only cover days that have happened - A single range is limited to about three months. If you pick an end date more than three months after the start, it is automatically pulled back to keep the report fast and readable.
Export to CSV (spreadsheet)
To work with the data in Excel or Google Sheets, click the CSV button in the top-right toolbar. It downloads a file named after the report and its dates. The file contains: - One row per record, with all the report's columns - A summary block at the bottom listing the report name, the period, key totals, and the date it was generated Note: the CSV button stays disabled until the report has finished loading - wait for the data to appear first. CSV is the right choice when you want to filter, sort, or do your own calculations on the numbers.
Print or save as PDF
For a polished, shareable document, use Print or PDF in the toolbar. Both open your browser's print dialog with a clean layout that hides the sidebar and menus and adds a header showing: - Your property logo and name on one side - The report title, category, and date range in the center - The Hostel Agent branding on the other side In the dialog, choose your printer to print on paper, or choose "Save as PDF" as the destination to keep a digital copy. The layout is sized for A4 and breaks neatly across pages for long tables.
Know when exports are unavailable
Sometimes the Print, PDF, or CSV buttons appear greyed out: - Export permission - your role may not include exporting. Certain reports (such as the inventory reports) require an export permission that the owner or a manager grants. If you need to export and cannot, ask them to update your role. - No data yet - the CSV button is disabled until the report has loaded its rows; if a period genuinely has no data, there is nothing to export. If a button is disabled, hover over it - a short tooltip explains why, so you know whether to wait, change the dates, or request access.
More in Reports
Reading Your Home Dashboard
Your Home screen is the daily command center: it shows live KPI stats, today's arrivals and departures, occupancy, and one-tap quick actions.
The Reports Hub
Find every report in one place. The Reports section is organized into a quick Summary & Charts view and a Detailed Reports grid grouped by category.
Opening & Reading a Report
Learn what you see inside any report - the title bar, the data table, the summary totals, and the buttons to print or export.
Occupancy & Revenue Reports
Track how full your property is and how much money it earns using the Daily Occupancy, RevPAR / ADR, and Room Revenue Summary reports.
Operations & Source Reports
See where your bookings come from and how your operation is running using the Booking Source, Cancellation, Payment, and Housekeeping Compliance reports.