Opening & Reading a Report
Learn what you see inside any report - the title bar, the data table, the summary totals, and the buttons to print or export.
Open a report from its card
From the Detailed Reports grid, click View Report on the report you want. It opens on its own full-page screen. At the very top you will see a toolbar: - A back link (an arrow next to the word Reports) that returns you to the report library - The report's name and category, next to its icon - Action buttons on the right: Print, CSV, and PDF Below the toolbar is a row of filters, and below that the report content itself. Reading top to bottom: title, then filters, then charts and tables.
Read the summary tiles (KPIs) at the top
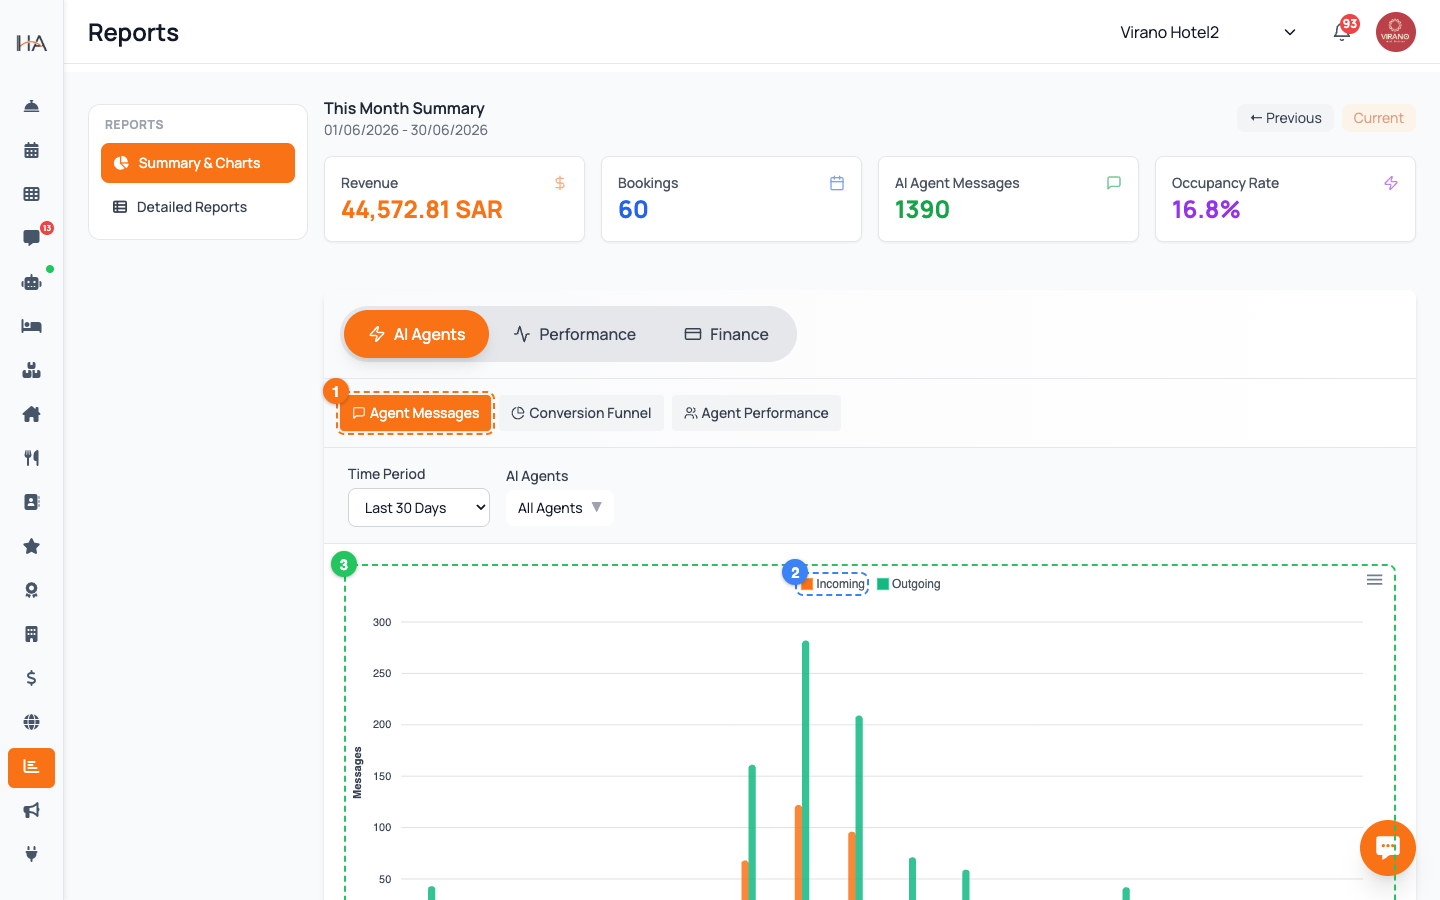
Most reports begin with a strip of summary tiles that total up the whole period you selected. Depending on the report, these may show: - Total Revenue and Total Bookings - Average Occupancy and Average Length of Stay - ADR (Average Daily Rate) and RevPAR (Revenue per Available Room) - Counts such as Total Arrivals, Total Cancellations, or Total Reviews These tiles answer the headline question instantly. Read them first, then look at the chart and table below for the detail behind the numbers.
Understand the chart
Many reports include a chart that turns the numbers into a shape you can read at a glance: - A line or bar over dates shows a trend - is occupancy or revenue rising or falling across the period? - A pie or donut shows a breakdown - for example, what share of bookings came from each source, or each payment method. Hover your mouse over any point, bar, or slice to see the exact value behind it. Use the chart for the story (the direction things are heading) and the table below it for the precise figures.
Read the data table row by row
Under the chart is a table with one row per record - per day, per booking, per unit, or per guest, depending on the report. The columns are the details that matter for that report. For example: - A Booking Summary row shows the booking ID, guest, check-in, check-out, nights, status, payment, source, and revenue - A Daily Occupancy row shows the date, total rooms, occupied, vacant, and occupancy % Scroll through the table to inspect individual records. Cancelled bookings and no-shows are clearly marked and are usually excluded from revenue totals so your figures stay realistic.
Adjust the filters to change what you see
The filter row under the toolbar controls exactly which data the report shows. You can: - Choose a property (group) and a specific unit - Pick a date range using the quick presets - Today, Yesterday, This Week, This Month, Last Month - or set your own From and To dates Quick presets apply with a single click. If you set custom dates, an Apply button appears - click it to load the new range. The whole report, including the summary tiles, chart, and table, updates to match. (Filtering and exporting are covered in detail in their own article.)
Print, save as PDF, or export to CSV
Three buttons on the top right let you take the report out of the dashboard: - Print - opens your browser's print dialog with a clean layout that shows your property logo and the report period - PDF - the same clean layout, ready to save as a PDF file from the print dialog - CSV - downloads a spreadsheet file you can open in Excel or Google Sheets, including a totals summary at the bottom The CSV button only works once the report has finished loading its data. If the export buttons are greyed out, your role may not include export permission.
Return to the report library
When you finish reading a report, click the back link at the top left - the arrow next to the word Reports - to return to the Detailed Reports grid. From there you can open another report. A practical workflow: 1. Open a report 2. Set the property, unit, and date range you care about 3. Read the summary tiles, then the chart, then the table 4. Print or export if you need a copy 5. Click back and open the next report Because every report shares the same layout, once you learn one you can read them all.
More in Reports
Reading Your Home Dashboard
Your Home screen is the daily command center: it shows live KPI stats, today's arrivals and departures, occupancy, and one-tap quick actions.
The Reports Hub
Find every report in one place. The Reports section is organized into a quick Summary & Charts view and a Detailed Reports grid grouped by category.
Occupancy & Revenue Reports
Track how full your property is and how much money it earns using the Daily Occupancy, RevPAR / ADR, and Room Revenue Summary reports.
Operations & Source Reports
See where your bookings come from and how your operation is running using the Booking Source, Cancellation, Payment, and Housekeeping Compliance reports.
Filtering, Date Ranges & Exporting
Master the filter bar on every report - property, unit, and date range - then print, save as PDF, or export to a spreadsheet.